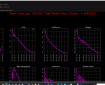
From an educational perspective, we review current COVID-19 data and arrive look at lockdowns and population density appears to have no numerical effect currently on COVID-19. In any case, this is more about exploring the code from a beginner’s standpoint with Python and DataFrames.
#covid19 #pandemicover #coviddata
CSV files found here:
https://ourworldindata.org/coronaviru…
Code: (Had to remove the angle brackets)
import numpy as np
import pandas as pd
from scipy import stats
import statsmodels.api as sm
import matplotlib.pyplot as plt
import pandas as pd
from scipy.stats import spearmanr
from scipy.stats import kendalltau
from scipy.stats import pearsonr
from scipy import stats
import seaborn as sns
import warnings
warnings.filterwarnings(“ignore”)
#Pandemic Claim Currently Invalid —Ralph Turchiano
data = pd.read_csv(‘owid-covid-data-19SEP2020.csv’)
data.info()
pd.set_option(‘max_columns’, None)
data.tail(5)
data[‘date’] = pd.to_datetime(data[‘date’])
data.info()
data_18SEP = data[data[‘date’]==’2020-09-18′]
data_ind = data_18SEP[data_18SEP[‘human_development_index’]=.8]
data_ind.head(10)
data_ind.drop([‘iso_code’,’continent’,’handwashing_facilities’,’stringency_index’,], axis=1, inplace=True)
data_ind.columns
data_ind[‘extreme_poverty’].fillna(0, inplace=True)
data_compare = pd.DataFrame([data.loc[37991],data.loc[41736]])
data_compare
data_compare.set_index(‘location’,inplace=True)
data_compare[‘total_cases_per_million’]
data_Swe_USA=pd.DataFrame(data_compare[[‘total_cases_per_million’,’new_cases_per_million’,’new_deaths_per_million’]])
data_Swe_USApd.DataFrame(data_compare[[‘total_cases_per_million’,’new_cases_per_million’,’new_deaths_per_million’]])
data_Swe_USA
data_ind.drop([‘date’,’new_cases’,’new_deaths’,’total_tests’, ‘total_tests_per_thousand’,
‘new_tests_per_thousand’, ‘new_tests_smoothed’, ‘new_tests’,
‘new_tests_smoothed_per_thousand’, ‘tests_per_case’,’tests_units’,’new_deaths_per_million’,’positive_rate’ ], axis=1, inplace=True)
data_ind.tail()
data_ind.dropna(inplace=True)
data_ind.corr(“kendall”)
data_18SEP.tail()
data_18SEP.loc[44310]
data_18SEP.loc[44310,[‘new_cases_smoothed_per_million’,’new_deaths_smoothed_per_million’]]
New =pd.DataFrame(data[[‘new_cases_smoothed_per_million’,’new_deaths_smoothed_per_million’]])
New.corr(‘kendall’)
dataw = data.loc[data[‘iso_code’] == ‘OWID_WRL’]
dataw
dataw.datetime = pd.to_datetime(data.date)
dataw.set_index(‘date’, inplace=True)
data_cl = pd.DataFrame(dataw[[‘new_deaths_smoothed’,’new_cases_smoothed’]])
data_cl.dropna(inplace=True)
data_cl.plot(figsize=(30,12))
data_cl.tail(20)
Categories: Misc....
Related Articles
-
 CERN Officials claim their Satanic Ritual Sacrifice was just them playing around- Mirror Online *Reposted at request
-
 Coronavirus variants predicts virus evolving to escape current vaccines, and allergic reactions +
-
 B6 may help keep COVID-19’s cytokine storms at bay
-
 Vitamin B6 may help keep COVID-19’s cytokine storms at bay, vaccines may cause mammograms false positives plus Data
